01 · Basic single-cell workflow on the Apple-silicon GPU#
This mirrors the rapids-singlecell basic workflow, but every accelerated step runs on the Apple GPU via MLX/Metal through metal-SingleCell (msc). The API is a drop-in for scanpy / rapids_singlecell: functions take an AnnData, compute on the GPU, and write results back to the standard slots — so plotting still uses scanpy.pl. We use the classic PBMC 3k dataset.
import warnings; warnings.filterwarnings('ignore')
import numpy as np, scanpy as sc
import metalsinglecell as msc
sc.settings.verbosity = 1
print('metalsinglecell', msc.__version__)
metalsinglecell 0.1.0
Load data#
adata = sc.datasets.pbmc3k()
adata.var_names_make_unique()
adata
AnnData object with n_obs × n_vars = 2700 × 32738
    var: 'gene_ids'
Quality control#
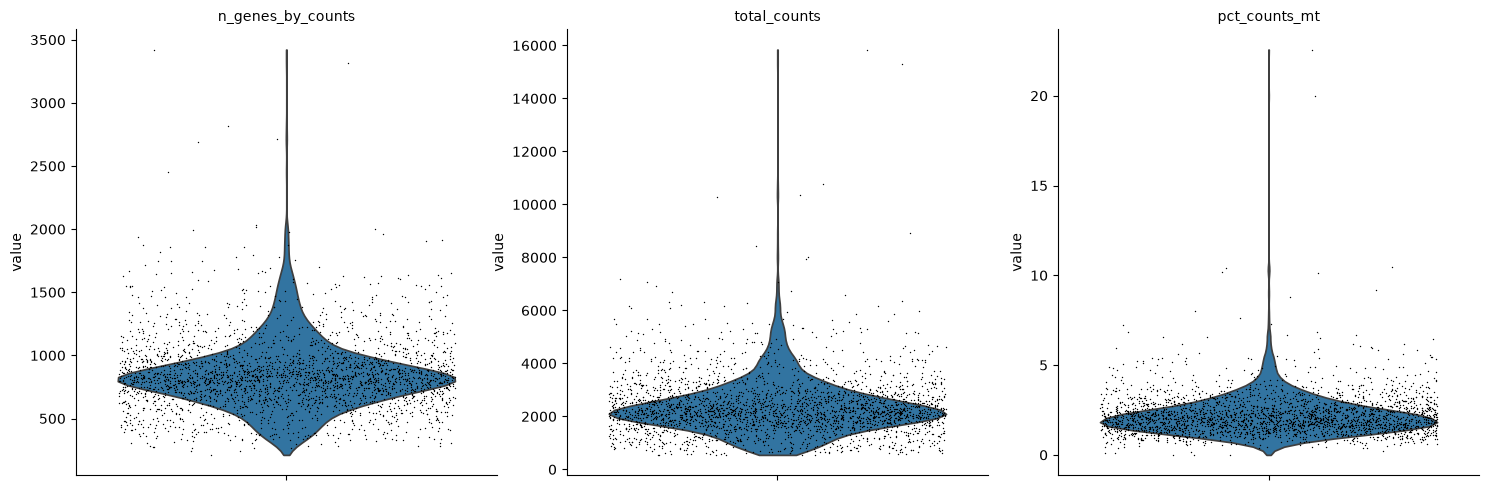
Flag mitochondrial genes and compute QC metrics (scanpy), then filter.
adata.var['mt'] = adata.var_names.str.startswith('MT-')
sc.pp.calculate_qc_metrics(adata, qc_vars=['mt'], inplace=True)
sc.pl.violin(adata, ['n_genes_by_counts', 'total_counts', 'pct_counts_mt'],
             jitter=0.4, multi_panel=True)
msc.pp.filter_cells(adata, min_genes=200)
msc.pp.filter_genes(adata, min_cells=3)
adata = adata[adata.obs.pct_counts_mt < 20].copy()
adata.shape
(2698, 13714)
Normalize, log1p, and highly variable genes#
All on the GPU.
adata.layers['counts'] = adata.X.copy()
msc.pp.normalize_total(adata, target_sum=1e4)
msc.pp.log1p(adata)
msc.pp.highly_variable_genes(adata, n_top_genes=2000, flavor='seurat')
adata.var.highly_variable.sum()
np.int64(2000)
adata.raw = adata
adata = adata[:, adata.var.highly_variable].copy()
Scale and PCA#
msc.pp.scale(adata, max_value=10)
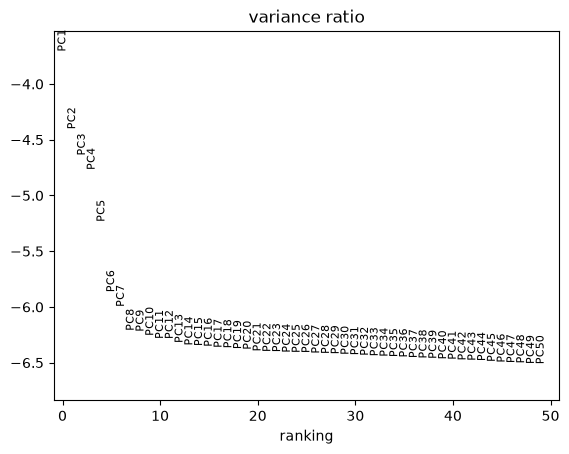
msc.pp.pca(adata, n_comps=50, use_highly_variable=False)
sc.pl.pca_variance_ratio(adata, log=True, n_pcs=50)
Neighbors, UMAP, and Leiden clustering#
backend='gpu' runs the Metal parallel Leiden.
msc.pp.neighbors(adata, n_neighbors=15)
msc.tl.umap(adata)
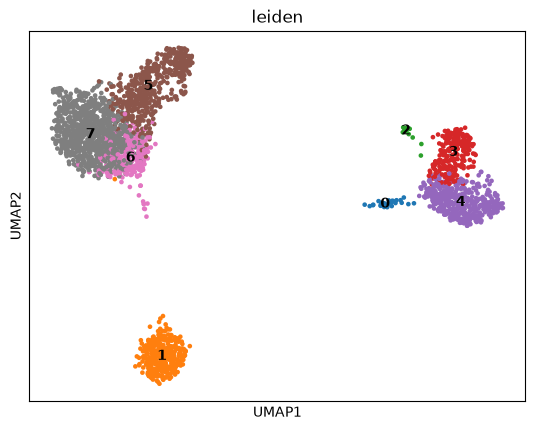
msc.tl.leiden(adata, resolution=1.0, backend='gpu')
adata.obs.leiden.value_counts()
leiden
7    929
5    489
4    414
1    348
3    234
6    233
0     36
2     15
Name: count, dtype: int64
sc.pl.umap(adata, color=['leiden'], legend_loc='on data')
Marker genes per cluster#
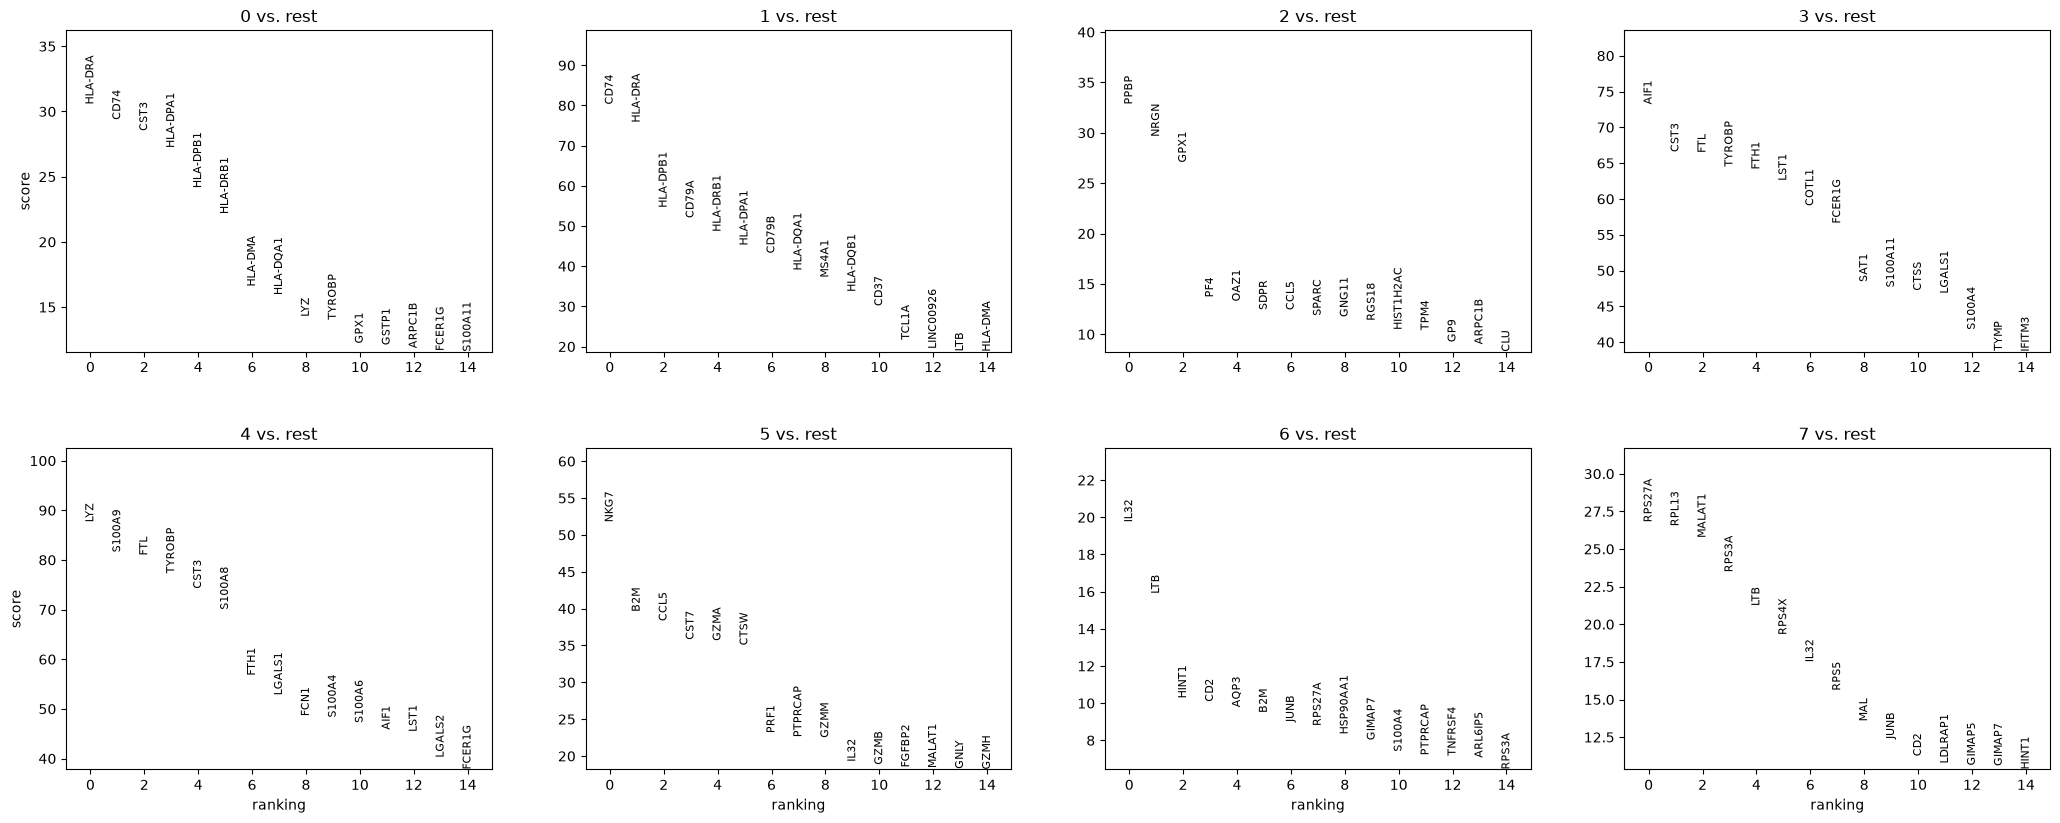
msc.tl.rank_genes_groups(adata, 'leiden', method='t-test')
sc.pl.rank_genes_groups(adata, n_genes=15, sharey=False)
Batch integration with Harmony (illustrative)#
PBMC3k has no real batch, so we add a synthetic one purely to demonstrate the harmony_integrate API; the corrected embedding is written to obsm['X_pca_harmony'].
adata.obs['batch'] = np.where(np.arange(adata.n_obs) % 2 == 0, 'A', 'B').astype(str)
msc.pp.harmony_integrate(adata, key='batch')
adata.obsm['X_pca_harmony'].shape
(2698, 50)
Diffusion map#
msc.tl.diffmap(adata, n_comps=15)
adata.obsm['X_diffmap'].shape
(2698, 15)
Every accelerated step (normalize_total, log1p, highly_variable_genes, scale, pca, neighbors, umap, leiden, rank_genes_groups, harmony_integrate, diffmap) ran on the Apple GPU; the AnnData object is identical in structure to a scanpy run.